

With so many reports, forecasts, and “must-know” numbers floating around, it’s easy to get lost in data that doesn’t change what you actually do.
This guide cuts through the noise.
Below, you’ll find four ecommerce statistics that matter most for brands, marketers, and store owners, covering market size, mobile buying behavior, cart abandonment, and customer expectations.
Key Ecommerce Statistics
- Global Ecommerce sales are forecast to reach $6.88 trillion in 2026, up 7.2% from last year.
- The global B2B Ecommerce market is valued at approximately $36 trillion in 2026 five times the size of B2C.
- Mobile commerce sales are projected to hit $2.74 trillion in 2026.
- The global average cart abandonment rate is 70.22%.
- Social commerce is a $2.11 trillion global market in 2026, growing at roughly 29% a year.
Global Ecommerce Market Size Statistics
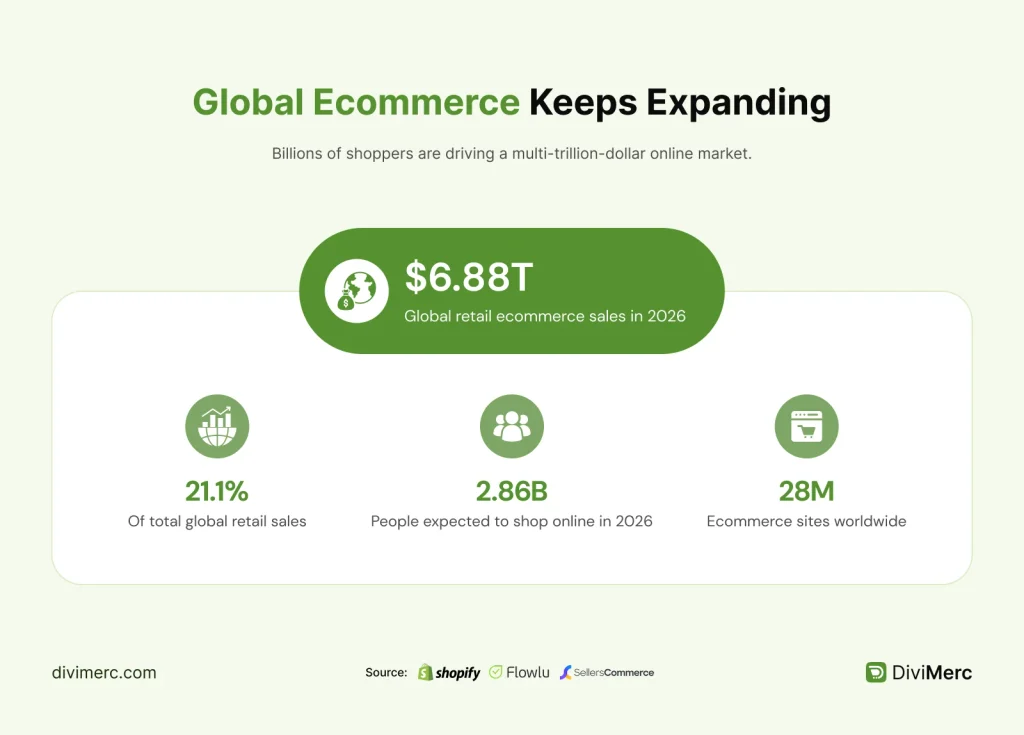
- Global retail Ecommerce sales are forecast to reach approximately $6.88 trillion in 2026. (Shopify)
- Ecommerce is projected to account for 21.1% of total global retail sales in 2026, climbing to roughly 22.5% by 2028. (Wiserreview)
- China, the US, and Western Europe together generated more than $5.17 trillion in Ecommerce sales last year, about 80.5% of the global total. (Shopify, via Craftberry)
- The global B2B Ecommerce market is valued at approximately $36 trillion in 2026, roughly five times larger than B2C ecommerce. (International Trade Administration)
- More than 2.86 billion people are expected to shop online in 2026. (Flowlu, via Charle)
- Cross-border Ecommerce represents approximately $1.74 trillion in annual transaction value. (Coherent Market Insights)
- There are roughly 28 million Ecommerce sites worldwide in 2026, with the US home to about half of them. (SellersCommerce)
Ecommerce Growth Statistics
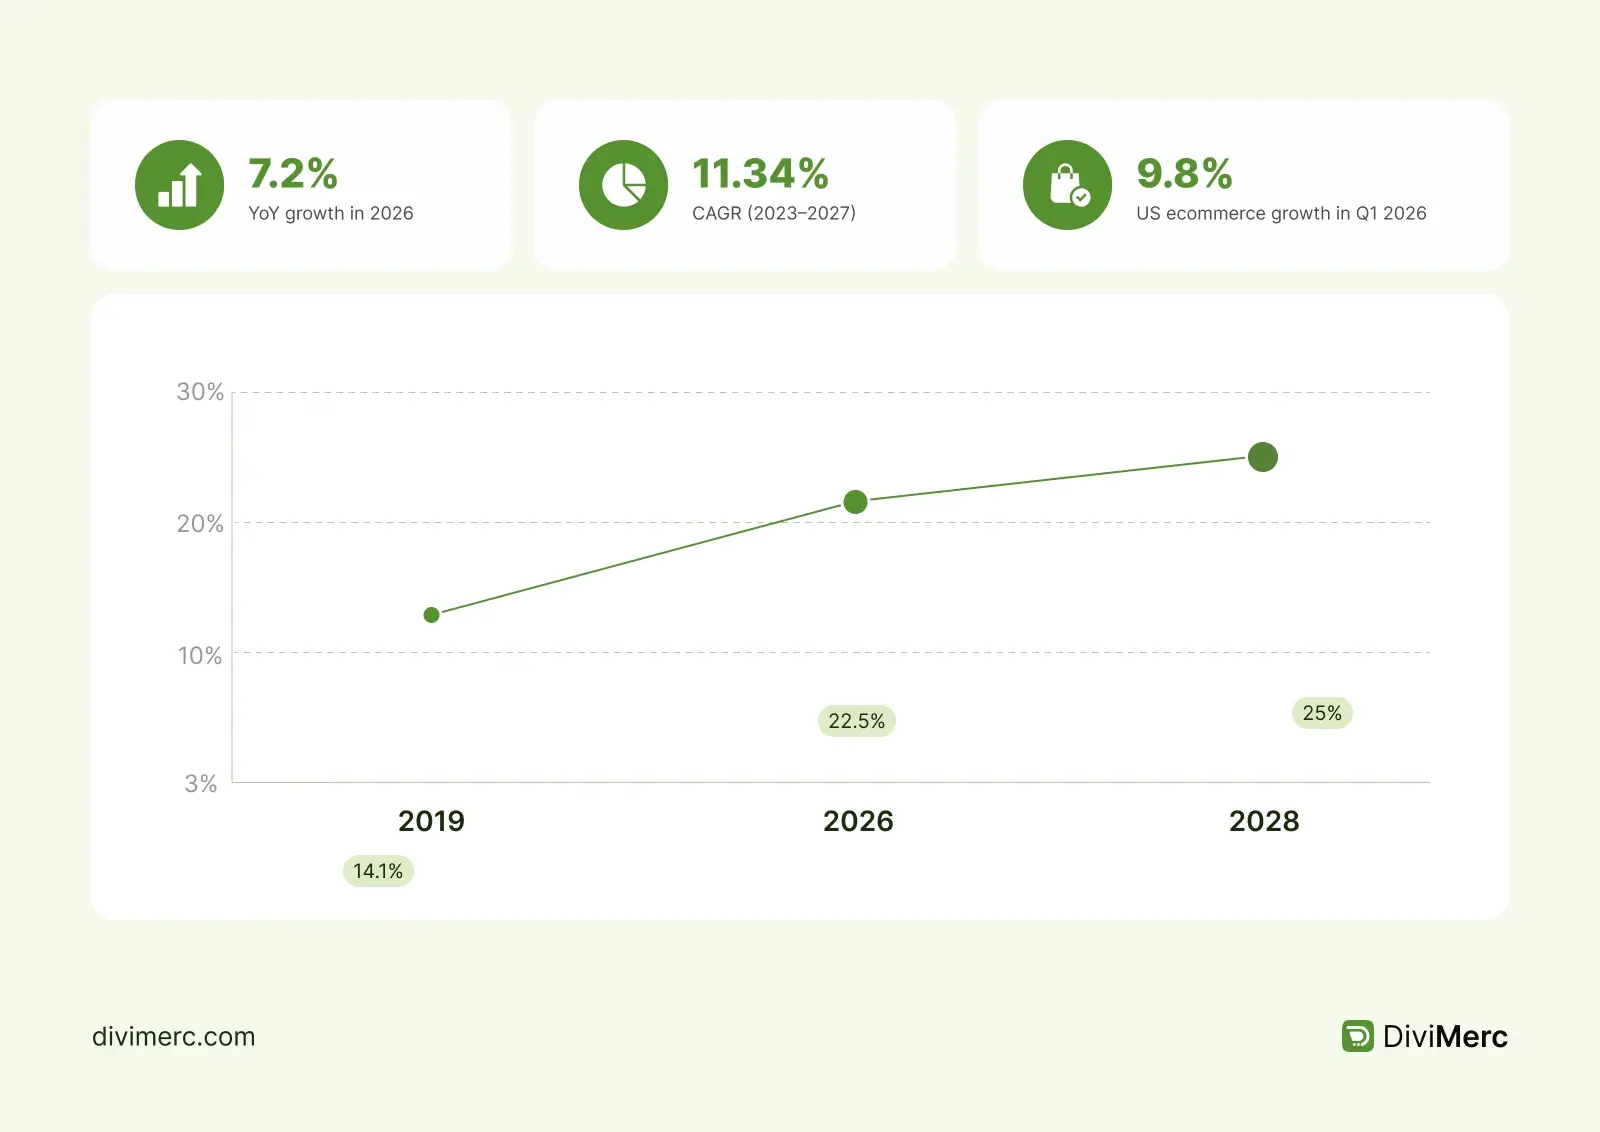
- Global Ecommerce sales are growing at 7.2% year over year in 2026 the slowest pace since 2022, but still more than double total retail growth. (EMARKETER, via Companies History)
- Annual Ecommerce growth has ranged from 5.9% (2022) to 9.6% (2023), stabilizing around 6.9% by 2028. (Craftberry)
- Worldwide Ecommerce sales are forecast to grow at an 11.34% CAGR between 2023 and 2027, led by Brazil (14.63%), Argentina (14.61%), and Turkey (14.33%). (Statista, via Bloggingwizard)
- US retail Ecommerce sales grew 9.8% year over year in Q1 2026 — more than double total US retail growth (3.9%). (US Census Bureau, via Companies History)
- Online retail's share of total global retail sales climbed from 14.1% in 2019 to 22.5% in 2026, and is projected to reach 25% by 2028. (Shopify, via EasyAppsEcom)
Online Shopping and Consumer Behavior Statistics
- Roughly 1.7 to 1.8 billion people worldwide make at least one online purchase every week, representing about 56% of adult internet users. (DataReportal, via Backlinko)
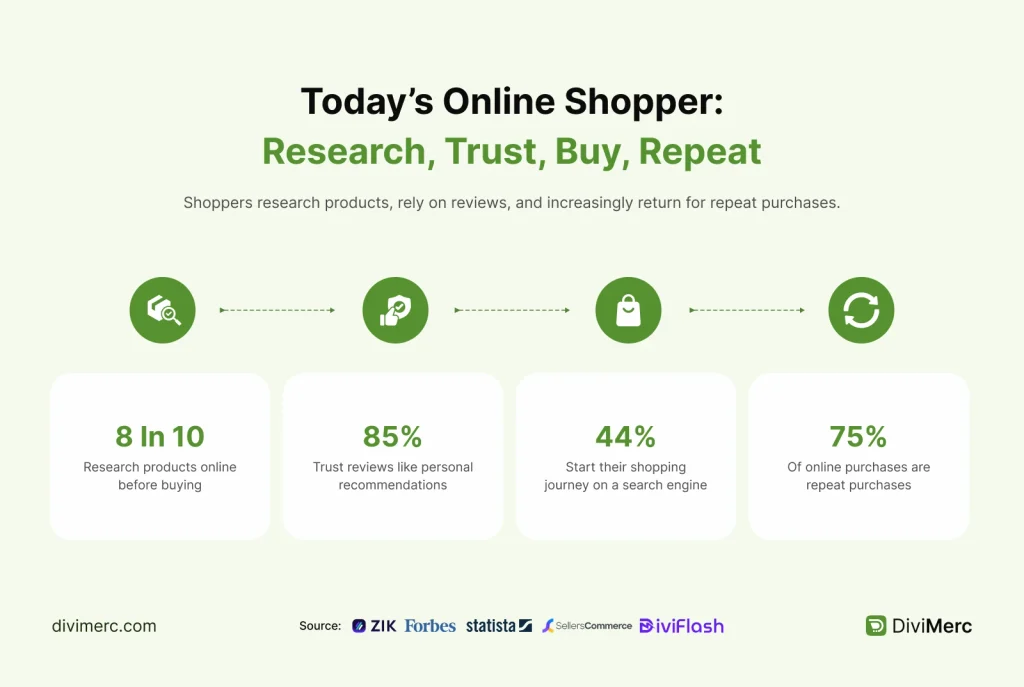
- About 75% of online purchases are repeat purchases. (ZIK Analytics)
- Around 81% online shoppers research a product online before buying it. (SQ Magazine)
- More than half (52%) of online consumers now order from both local and international websites. (EMARKETER, via Forbes Advisor UK)
- Average order value on desktop runs about $159, versus $100–$105 on mobile and tablet. (Statista, via ClickPost)
- 85% of customers trust online reviews as much as personal recommendations. (Web Alive, via WebFX)
- 44% of shoppers start their shopping journey on a search engine; 41% start directly on a marketplace like Amazon. (SellersCommerce)
- 26% of first impressions of a website are design-related, shaping trust before a shopper reads any product copy. (Hostinger)
Ecommerce Statistics by Country and Region
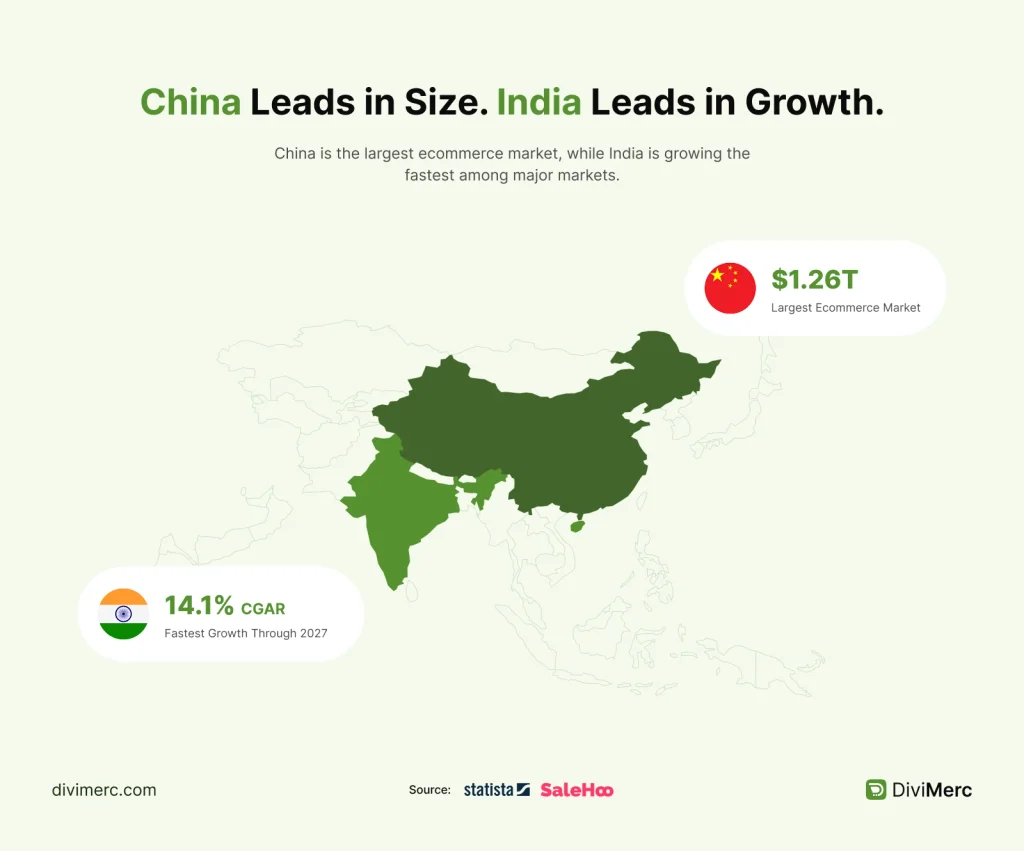
- China is the largest Ecommerce market, generating roughly $1.26 trillion in online sales, followed by the US at approximately $1.07 trillion. (SaleHoo)
- China and the US are the only countries with Ecommerce markets exceeding $1 trillion; China alone makes up ~83% of Asia-Pacific ecommerce. (Forbes Advisor UK)
- Online sales are projected to account for more than 28% of all UK retail sales in 2026, Europe's largest Ecommerce market. (Ecommercetrix)
- India leads Ecommerce growth among major markets through 2027 with a 14.1% CAGR — the fastest Statista tracks. (Statista, via Charle)
- Latin America is the fastest-growing region at 12.2% YoY, on pace for $191.25 billion in 2026; Mexico is set to surpass US penetration. (Shopify)
- Southeast Asia is growing roughly 18.6% a year, on a path toward $230 billion in GMV in 2026. (Mobiloud)
- Six of the world's ten fastest-growing Ecommerce markets are in Asia. (Lengow)
Note: country-level revenue estimates vary widely by methodology (marketplace GMV vs. direct retail sales); treat dollar totals as directional growth-rate trends that are far more consistent across sources.
Mobile Commerce Statistics
- Mobile commerce sales are projected to reach $2.74 trillion in 2026, up 9.16% YoY, and $3.02 trillion by 2027. (SellersCommerce)
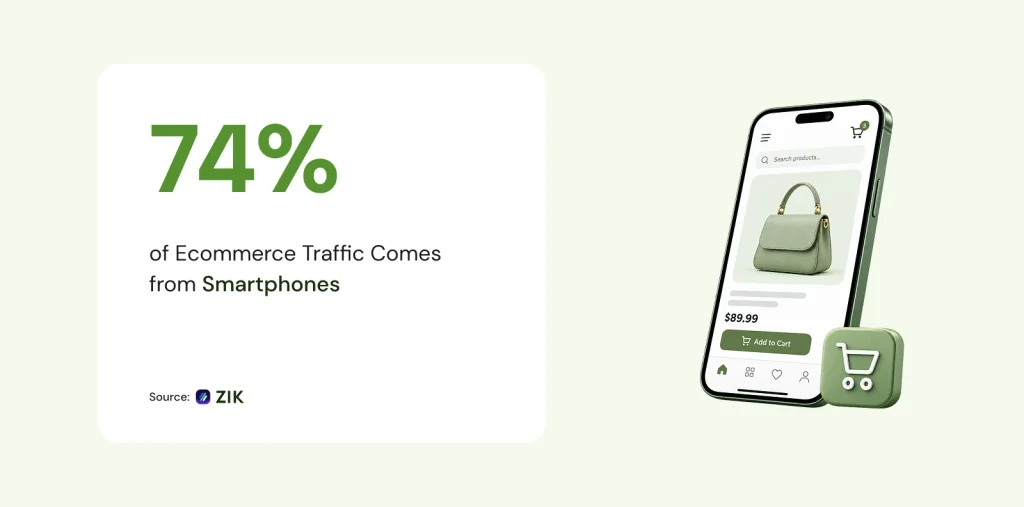
- Smartphones generate roughly 74% of Ecommerce traffic worldwide, and over 60% of online orders are placed from a phone. (ZIK Analytics)
- In China, 92% of shoppers use their phone to shop. (M&K)
- Mobile generates about 72% of Ecommerce sessions worldwide but only around 55% of revenue the “mobile conversion gap.” (Searchlab)
- In 2026, the mobile cart abandonment rate sits at approximately 75.5% to 80% globally. (Content Square)
- Retail m-commerce sales alone are projected to exceed $2.4 trillion to $2.5 trillion globally in 2026. (Growth Engines)
Ecommerce Conversion Rate Statistics
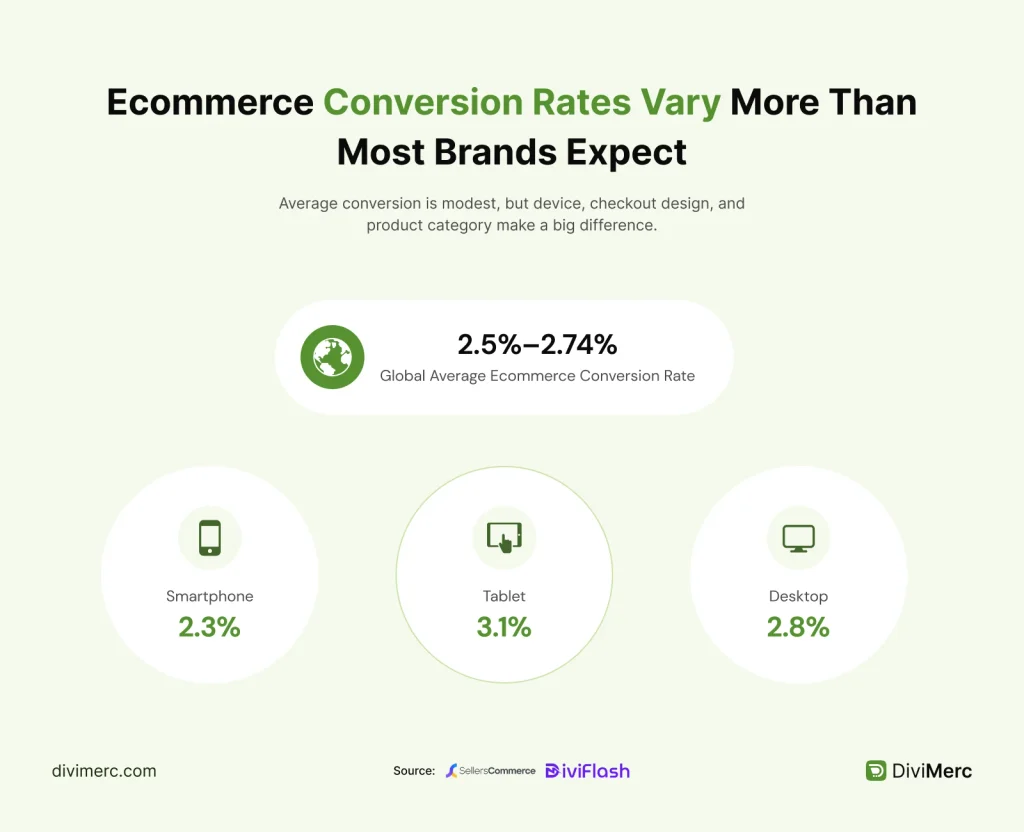
- The global average ecommerce conversion rate in 2026 sits roughly between 1.8% and 3.0%, depending on the data source and industry mix. (Suplex Design)
- Desktop ecommerce conversion rates generally average between 3.4% and 4.0%, along with smartphones at 1.8% to 2.5% and tablets at 2.5% to 3.5%. (Kiss Metrics)
- On some benchmarks the device gap is even wider: desktop converts at 4.8% versus 2.1% on mobile. (Searchlab)
- Better checkout design alone can lift conversion rates by up to 35.26% on large Ecommerce sites. (Baymard Institute)
- Conversion varies enormously by category: beauty converts around 5.37%, while luxury and jewelry average just 0.71%. (Dynamic Yield)
Shopping Cart Abandonment Statistics
- The average cart abandonment rate stands at 70% globally. (Stripe)
- 48% of shoppers abandon carts because shipping fees, taxes, or other charges made the total higher than expected. (Ringly)
- Baymard estimates roughly $260 billion in lost US and EU orders is recoverable through better checkout design. (Cartflows)
- The Middle East and Africa region records the highest regional abandonment rate at 93%. (SellersCommerce)
- Abandoned-cart recovery emails convert at roughly 44.76% on average. (Mailmend)
- Most stores recover only 3–5% of abandoned carts through standard recovery flows; top performers recover 10–14%. (DontPayFull)
Social Commerce & Social Media Ecommerce Statistics
- The global social commerce market is worth roughly $2.11 trillion in 2026, growing ~29% a year toward $7.55 trillion by 2031. (Mordor Intelligence)
- US social commerce sales are expected to cross $100 billion for the first time in 2026. (The Matchbox)
- TikTok Shop has more than 15 million sellers worldwide and is expected to reach $123.5 billion global sales in 2026. (Demandsage)
- 72.3% to 72.9% of consumers use social media for product discovery and research before buying. (The Goat Agency)
- 44% of Gen Z shoppers have bought something directly on a social media platform. (Sprout Social)
- 58% of TikTok Shop sales originate from short-form video content rather than static listings. (Fit Small Business, via AutoFaceless)
- Live shopping converts at up to 30%, compared with just 2–3% for a traditional product page. (Dataintelo)
- 92% of consumers say they'd buy directly from a brand on social media instead of a marketplace, especially with a good deal. (inBeat Agency)
AI in Ecommerce Statistics
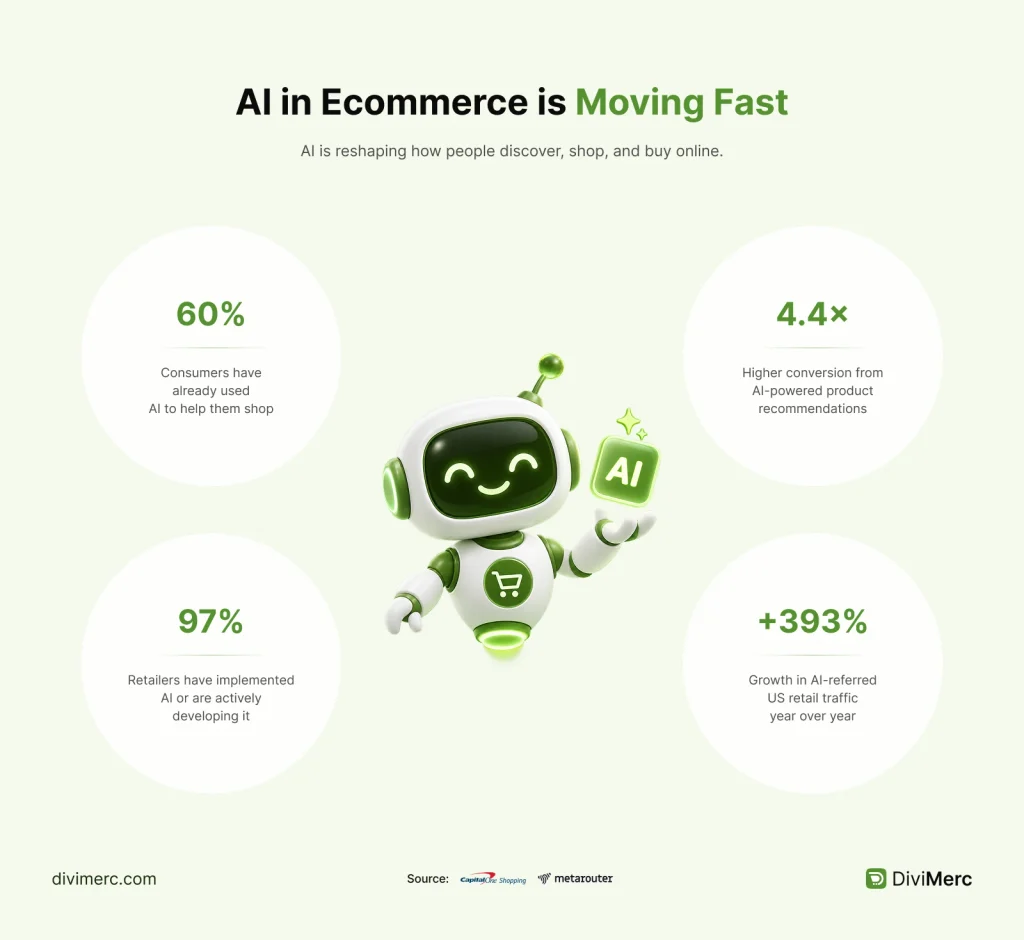
- 60% of consumers say they've already used AI to help them shop; 76% want AI-powered shopping assistants. (Capital One Shopping)
- 97% of retailers say they've implemented AI or have an AI program in active development. (Capital One Shopping)
- AI-generated product recommendations convert at roughly 4.4x the rate of traditional search-driven recommendations. (McKinsey, via MetaRouter)
- By 2030, nearly 50% of online shoppers are expected to use AI agents for shopping, accounting for ~25% of spend and adding an estimated $115 billion to US ecommerce. (Kearney, via commercetools)
- In 2026, AI referral traffic currently represents just over 1% of total web visits and is growing by roughly 1% each month. (Conductor)
- 73% of consumers are already using AI somewhere in their shopping journey — for ideas (45%), review summaries (37%), and price comparisons (32%). (commercetools)
- Salesforce data attributes 20% of all US holiday retail sales in late last year about $262 billion to AI and agents through recommendations and engagement. (Salesforce, via Teal Packaging)
- Amazon's Rufus AI shopping assistant grew monthly active users 115% year over year, with engagement up roughly 400%, ahead of its merge into Alexa for Shopping. (Amazon Q1 2026 earnings, via Nova)
Voice Commerce & AR/VR Shopping Statistics
- The global voice shopping market is projected to total $55–$77.3 billion worldwide in 2026. (Juniper Research; Capital One Shopping)
- 39% of smart device users have made a purchase using their device's voice-enabled shopping capabilities. (Capital One Shopping)
- 35.7% of US adults have used a voice assistant for some shopping-related activity, but only 11.3% have completed a purchase entirely through voice. (EasyAppsEcom)
- Voice shopping is projected to drive up to 30% of Ecommerce revenue by 2030 if current growth holds. (Ringly, citing multiple forecasts)
- More than 100 million consumers used AR shopping features last year, and roughly 75% of shoppers say AR helps them assess products before buying. (BigCommerce)
- 70% of shoppers say AR apps would encourage them to shop more frequently, and 64% say AR increases their loyalty to a brand. (Market.us)
Ecommerce Payment Statistics
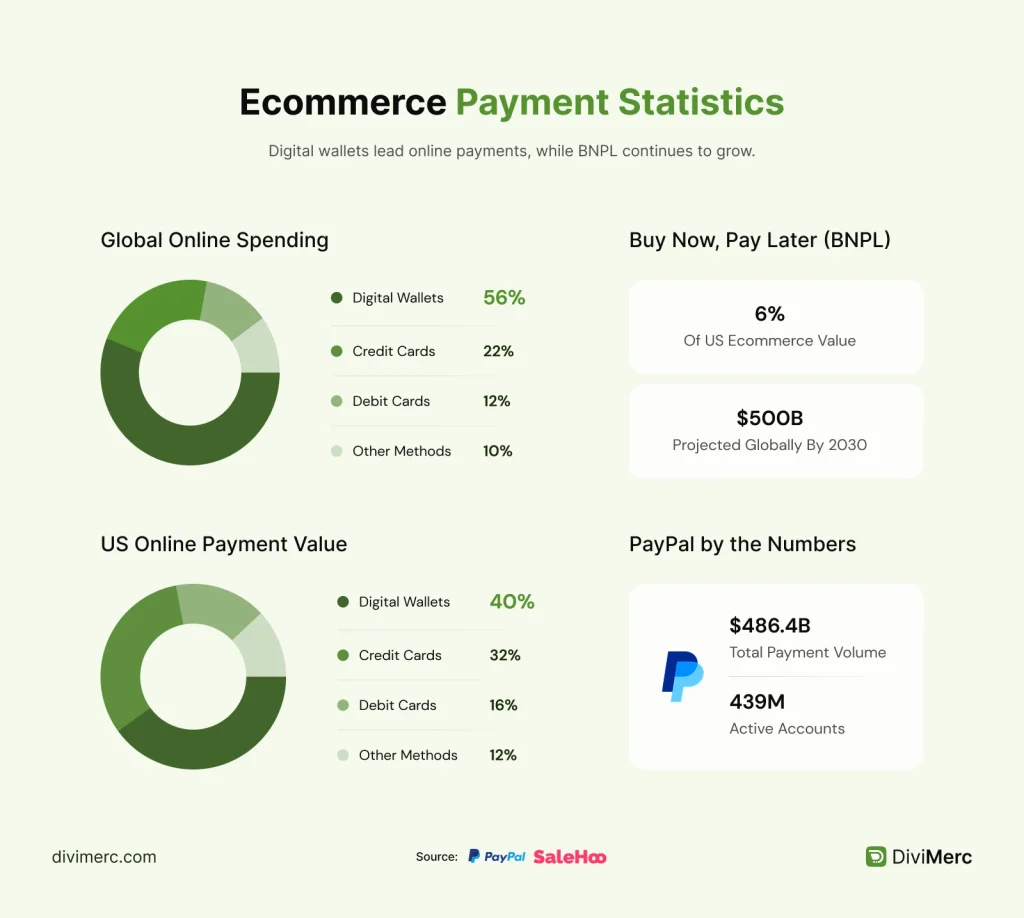
- Digital wallets account for 56% of global online spending, per a 2026 survey spanning 40+ markets. (Global Payments)
- Within the US, online payment value splits roughly 40% digital wallets, 32% credit cards, 16% debit cards. (Payments Drive)
- Buy Now, Pay Later (BNPL) represents around 6% of US Ecommerce value and is forecast to reach $500 billion globally by 2030. (Worldpay, via SaleHoo)
- PayPal reported 439 million active accounts and $486.4 billion in total payment volume in its most recent quarter. (Chargeflow)
B2B Ecommerce Statistics
- The global B2B Ecommerce market is valued at approximately $36 trillion in 2026, growing at a 14.5% CAGR. (International Trade Administration, via Ringly)
- Asia-Pacific is expected to command around 80% of global B2B Ecommerce value in 2026. (Accio)
- US B2B Ecommerce site sales reached $2.297 trillion in 2024, up 10.5% YoY, projected to hit $3.027 trillion by 2028. (Digital Commerce 360, via Ringly)
- 61% of B2B buyers now prefer a rep-free buying experience; 83% define their purchase requirements before ever speaking to a salesperson. (Consensus; Forrester, via ScubeMarketing)
- 39% of B2B buyers are willing to place a self-service order above $500,000; 20% would place orders over $1 million digitally. (Elogic Commerce, 2026 State of B2B Ecommerce report)
- Self-service already drives about 34% of B2B online revenue, alongside remote sales-rep interactions. (McKinsey & Company, via Salsify)
- 94% of B2B buyers now use AI tools like ChatGPT at some point during their buying process; 84% say AI helps them decide faster. (Thunderbit, citing 2026 buyer research)
Ecommerce Returns Statistics
- The average Ecommerce return rate is running around 19.3%–20% heading into 2026 — more than double the in-store rate. (3PL Insider)
- US retail returns totaled approximately $849.9 billion last year, about 15.8% of total retail sales. (Carriyo)
- 82% of consumers say free returns are an important factor when deciding where to shop online. (National Retail Federation & Happy Returns)
- Apparel remains the most-returned category, with return rates typically ranging from 20% to 40%. (Eightx)
- 65.2% of merchants now charge a fee for mail-in returns, averaging $9.04, as blanket free returns become less common. (eFulfillmentService, 2026 Return Crisis analysis)
Ecommerce Fraud & Security Statistics
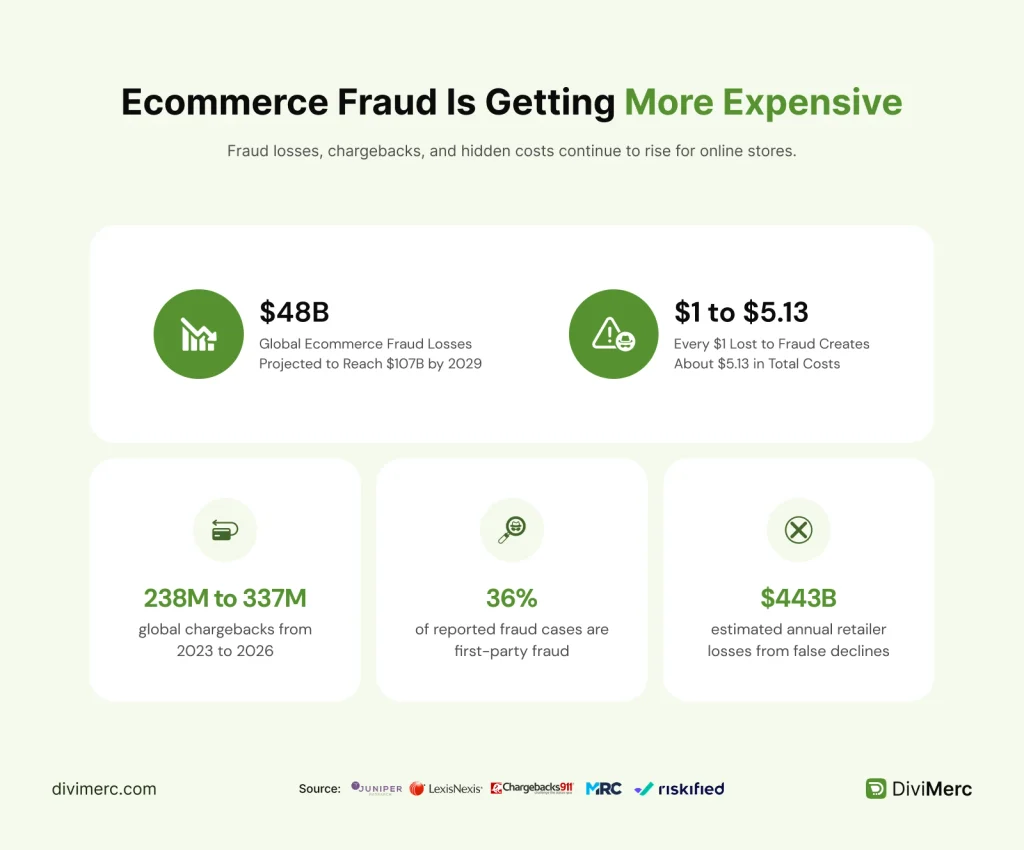
- Global Ecommerce fraud losses reached $48 billion last year and are projected to climb toward $107 billion by 2029. (Juniper Research, via Ringly)
- Merchants lose roughly 3%–3.2% of total Ecommerce revenue to payment fraud, rising to around 5% in high-risk markets. (Mastercard; CoinLaw)
- For every $1 lost to fraud, merchants incur about $5.13 in total costs once chargebacks, fees, and labor are counted. (LexisNexis 2026 True Cost of Fraud study, via Chargeflow)
- Global chargeback volume is projected to climb from 238 million (2023) to 337 million by 2026, a 41% increase. (Chargebacks911)
- First-party (“friendly”) fraud is now the leading fraud type globally, representing about 36% of all reported fraud cases. (Merchant Risk Council, via Chargeflow)
- False declines cost retailers an estimated $443 billion a year globally — roughly nine times more than actual fraud losses. (Riskified, via Ringly)
Subscription Ecommerce Statistics
- Subscription Ecommerce is projected to surpass $450 billion in market value. (ZIK Analytics)
- That market is projected to reach $5.35 trillion by 2030 as AI personalization and niche subscription models expand. (Research and Markets)
- High-risk subscription merchants alone process an estimated 238 million annual chargebacks, underscoring the operational complexity of recurring billing. (Swell)
Ecommerce Shipping, Delivery & Fulfillment Statistics
- The global parcel delivery market is projected to reach $538 billion in 2026, with roughly 236 billion packages delivered worldwide. (Don't pay full)
- 80% of consumers now expect same-day delivery to at least be offered as an option; the global same-day delivery market is worth $17.8–$21.8 billion in 2026. (Capital One Shopping; Opensend)
- 74% of shoppers expect delivery within two days, and 63% will choose a different retailer if shipping takes longer. (Opensend; Capital One Shopping)
- Last-mile delivery now accounts for roughly 53% of total shipping costs, up from 41% in 2018. (Ringly)
- 67% of shoppers have abandoned a cart because of the delivery offering, and 52% of Ecommerce businesses cite delivery as a reason customers abandon purchases. (Simple Global)
- Retailers offering 2-day or faster delivery see conversion rates climb roughly 10.5% versus standard shipping; same-day delivery adopters report 66% conversion improvements. (Jitsu and Coresight, via Cahoot)
Ecommerce Platform & CMS Market Share Statistics
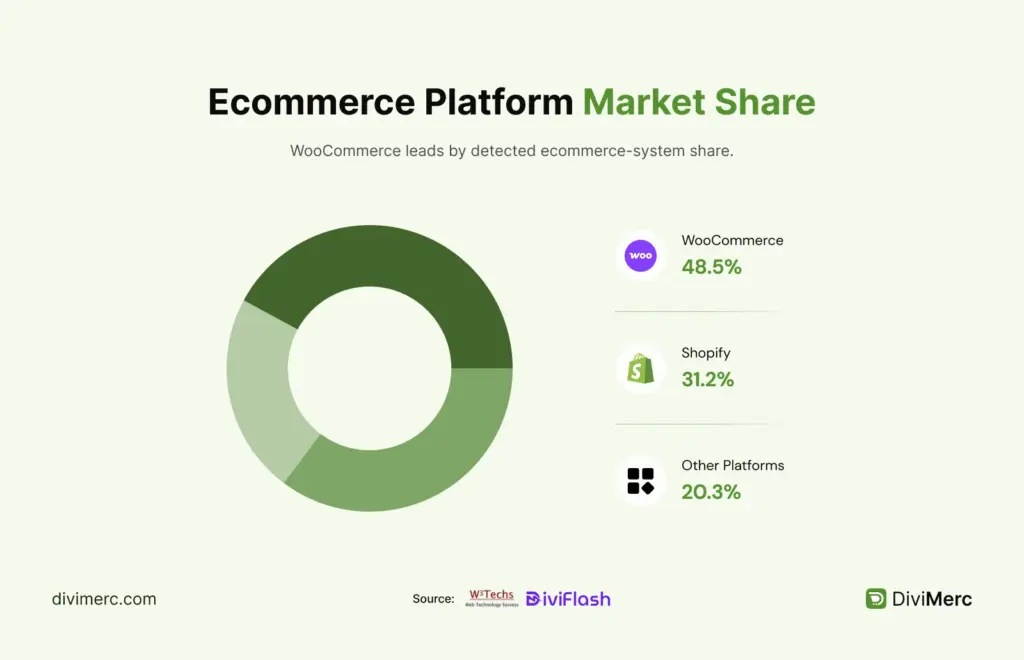
- WooCommerce holds roughly 8.2% of the detected ecommerce-system market, ahead of Shopify at about 5.3 % (Webtonic)
- WordPress powers 41.2% of all websites and holds 59.1% of the known CMS market. (W3Techs, via DiviFlash)
- Shopify reported full-year (last year) revenue of $11.56 billion, up 30% year over year, with B2B GMV growing 96% YoY. (Shopify, via Risingtrends)
- WooCommerce remains the leading platform by raw store count (roughly 4.5 million active stores), while Shopify leads among the highest-traffic sites. (StoreLeads; Cloudways)
Platform market-share figures vary dramatically by source (18%–65%+ for the same platform) depending on whether the count includes all detectable sites, only active stores, or only high-traffic sites that always check the methodology before citing a single number.
Ecommerce Trends and Future Predictions
- Agentic commerce is emerging fast: by 2030, roughly 50% of online shoppers are expected to use AI agents for part of their shopping. (Kearney, via commercetools)
- 80% of consumers say they're willing to pay an average of 9.7% more for sustainably produced or sourced goods. (Woola)
- Roughly 70% of shoppers now buy products from international sellers, reflecting continued cross-border Ecommerce growth. (Hostinger)
- Grocery and food delivery is the fastest-growing Ecommerce category, expanding 18–22% annually. (EasyAppsEcom)
- The broader social and video commerce market is on a path toward $8.5 trillion globally by the early 2030s. (Accenture; Mordor Intelligence, via Forbes Advisor UK)
- By 2040, online purchases could account for as much as 95% of all retail sales globally, per long-range industry projections. (Ecomrankd)
What These Ecommerce Statistics Mean for Businesses
- Close the mobile-to-revenue gap, mobile drives most traffic but a smaller share of revenue; simpler checkout and native wallets are high-leverage fixes.
- Treat cart abandonment as a checkout problem, not a traffic problem, clearer costs and fewer form fields beat more ad spend.
- Show up where discovery happens, social platforms and AI tools are doing more of the product research than a store's own site.
- Offer payment flexibility, wallets and BNPL are mainstream expectations, not edge cases.
- Budget for fraud and returns as ongoing cost centers, both are rising steadily and need dedicated policy, not an afterthought.
- Get product data AI-ready, clean, structured content is what makes a brand visible to AI shopping assistants, not just search engines.
- Don't ignore B2B, buyer behavior there is converging fast with B2C self-service norms.
Final Thoughts
Ecommerce is growing but growth alone does not guarantee sales.
The brands that win are usually not the ones chasing every new trend or publishing the longest list of statistics. They focus on the fundamentals: a fast mobile experience, a simple checkout, transparent delivery information, and a reason for customers to come back.
Start with the four numbers above. Then use them to audit your own store





0 Comments